Newsroom
Welcome on Groupe Credit Agricole Newsroom

08-11-2019
Results for the third quarter and the first nine months of 2019
Results for the third quarter and the first nine months of 2019

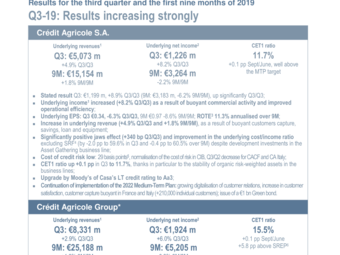
Q3‑19: Results increasing strongly
|
Crédit Agricole S.A. |
||
|
Underlying revenues[1] Q3: €5,073 m |
Underlying net income[2] Q3: €1,226 m |
CET1 ratio 11.7% |
|
- Stated result Q3: €1,199 m, +8.9% Q3/Q3 (9M: €3,183 m, -6.2% 9M/9M), up significantly Q3/Q3; |
||
|
Crédit Agricole Group* |
||
|
Underlying revenues1 Q3: €8,331 m |
Underlying net income2 Q3: €1,924 m |
CET1 ratio 15.5% |
|
- Stated net income2 for Q3: €1,849 m, +4.5% Q3/Q3 (9M: €5,012 m, -5.0% 9M/9M); * Crédit Agricole S.A. and 100% of Regional Banks. |
||
Crédit Agricole S.A.
Strong increase in underlying quarterly net income Group share
- Underlying net income Group share: Q3-19 €1,226 m, +8.2% Q3/Q3, 9M-19 €3,264 m, -2.2% 9M/9M, increase in business line results (excluding Corporate Centre) (+6.8% Q3/Q3, +2.4% 9M/9M);
- Solid contributions from the Asset Gathering division, GOI still strong in French Retail Banking, and strong growth (+24%) in the contribution of CA Italia, good cost control and strong contribution from automotive partnerships in Specialised Financial Services, and solid performance in capital markets, with an increase in the contribution from Large Customers despite the reversal of the cost of risk in the division;
- Over 9M-19, underlying net income Group share high (€3,264 m) despite the CC’s contribution being penalised by a high H1-18 base, the +2.0 pp increase in the corporate income tax rate, and the measured increase in the cost of risk, due to the normalisation in CIB;
- Annualised underlying ROTE[7] 11.3%, good profitability in all business lines.
Increase in underlying revenues Q3/Q3 (+4.9%) and 9M/9M (+1.8%), as a result of dynamic commercial activity
- String inflows in Asset management, Insurance, Wealth management and Asset servicing. Record net inflows for Amundi;
- Property and casualty insurance outperforming the French market (6.8% increase in premiums Q3/Q3), increase in customer equipment rates (+1.5 pp for the Regional Banks Sept./Sept., +1.2 pp for LCL);
- Continued growth in loans and customer savings, increase in equipment rates, and continuing momentum of customer capture in Retail Banking (+210,000 individual customers since the end of 2018 (+156,000 at the Regional Banks, +40,000 at LCL, +16,000 at CA Italia);
- Strong performance of the automotive partnerships, generating equity-accounted income;
- Commercial activity strong in capital markets, commercial banking positions maintained in a slowing syndicated loan market in the eurozone.
Very positive jaws effect (+340 bp) and improvement in the cost/income ratio
- Underlying costs: +1.5% Q3/Q3, due in particular to the development of international and corporate insurance. Positive jaws effect in the Retail banking and Large customer business lines. Costs stable in Specialised financialsServices.
- Underlying cost/income ratio at 59.6% (-2.0 pp) in Q3, and 60.5% over 9M (-0.4 pp);
- Cost of risk low, at 29 bp, normalisation in CIB, down at CACF and at CA Italia:
Financial strength confirmed this quarter
- CET1 ratio at 11.7%, +0.1 pp Sept/June, risk-weighted assets stable in the business lines;
Continuing implementation of the 2022 Medium-Term Plan
- Increase in NPS[8] in Retail banking, digital interaction with customers strengthened, customer capture buoyant in France and Italy (+210,000 individual customers since the end of 2018).
- Issuance of a non-preferred senior Green bond for €1 billion in October.
- Upgrade by Moody’s of Crédit Agricole S.A.’s long-term credit rating to Aa3.
Footnotes
[1] In this press release, the term “underlying” refers to intermediary balances adjusted for the specific items described on p.17 and onwards
[2] Net income Group share
[3] Underlying, excluding specific items, see p. 17 onwards for more details on specific items and p. 27 for the calculation of the ROTE
[4] Contribution to the Single Resolution Fund (SRF)
[5] Average over last four rolling quarters, annualised
[6] Based on the 9.7% SREP requirement (including countercyclical buffer)
[7] See calculation of ROTE p. 27; annualised rate calculated without restating IFRIC21 charges, taking into account AT1 coupons deducted directly from Group net equity; RONE of the divisions and business lines calculated using the same method
[8] Net Promotor score, calculated by Institut BVA (H1-2019) and corresponding to the gap between promoters and detractors.

CASA_2019-Q3_PR_EN_déf .pdf
08-11-2019

2019 Q3 Results CA Group
08-11-2019

2019 Q3 Results Credit Agricole S.A. $ACA
08-11-2019
Our press contact

Press Department Crédit Agricole Group

